
Visualizing Air – https://www.redbullborahansgrohe.com/en/news/an-aero-revolution-in-the-catesby-tunnel ; Red Bull Content Pool / George Marshall
Visualizing Air — Best of Web F2026
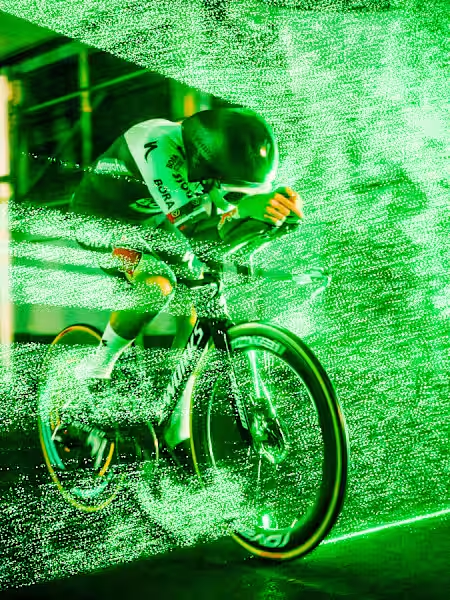
Image and article (for further reading) from: https://www.redbullborahansgrohe.com/en/news/an-aero-revolution-in-the-catesby-tunnel ; Images by Red Bull Content Pool / George Marshall, Published 11.11.2025
Aerodynamics has always been a major factor of cycling. For the pro peloton, there is heavy emphasis on marginal gains, where saving 7 watts can be the difference between winning and losing on certain cycling stages; saving energy by improving the aerodynamics of both the rider and bike can lead to victory in this sport. The team at Redbull Bora Hansgrohe, in collaboration with Specialized and LaVision, focused on taking Formula 1 (F1) approaches and applying it to the world of cycling.
This image depicts a cyclist riding through a particle image velocimetry (PIV) test, which measures both the speed and direction of individual air particles through a section that the rider passes through. The PIV test illuminates millions of helium air with lasers and captures the flow with a high speed camera, which then is put into a computational fluid dynamics program to visualize and quantify air flow. This test was conducted at the Catesby Aero research Facility, where every climatic factor was controlled and over 100 test runs at the same speed, position, and line were conducted.
The idea of quantifying rider position, bike design and geometry, clothing material, and other factors of cycling through direct measurements and visualization of air flows/vortices is the best representation of art and science. Previously, wind-tunnels were designed to calculate the wattage of varying setups, but the inclusion of the PIV will allow for in-depth, real-user analysis and accurate imagery to target specific areas that may not have been shown in wind-tunnel analysis of CFD models.


4 Comments. Leave new
First prize – I love Dan Bigham’s work, both a brilliant aerodynamicist and one of the fastest in the world on his own. The photographer did a great job capturing this process. PeakTorque on YouTube likes to discuss how unreliable the ‘visual windtunnel’ is: just looking at a position and saying it seems faster. So taking advantage of real visualization techniques to quantify changes is so interesting and useful!
Second Prize – This image reminds me of the matrix, it also connects with my love for cycling and the effort put into aerodynamic gains. Great pull.
First Prize – This image is really striking with the colors and the bikers visual. The science of tracking aerodynamics with PIV in sport is a fun and interesting application of fluid dynamics. Overall the image depicts great engineering and aesthetics.
Second Prize – This image immediately caught my eye as the way the helium air is illuminated depicts both amazing fluid mechanics as well as an awesome visual that looks like it is straight out of a sci-fi movie. Both the wow-factor and the technical aspects of this image create a beautiful piece of artwork.