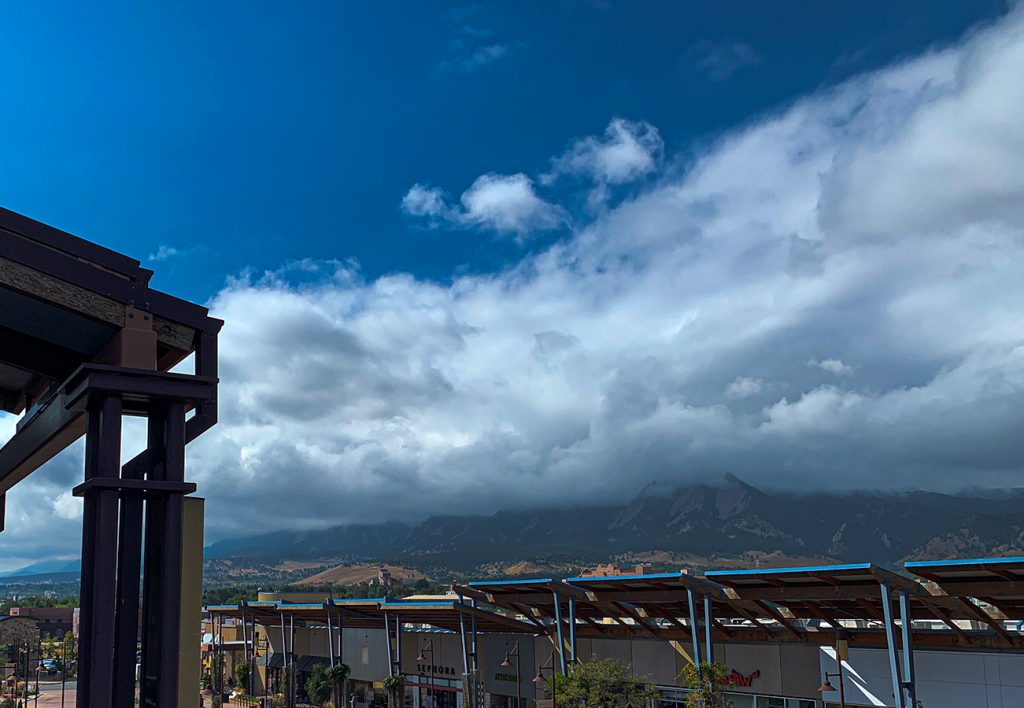
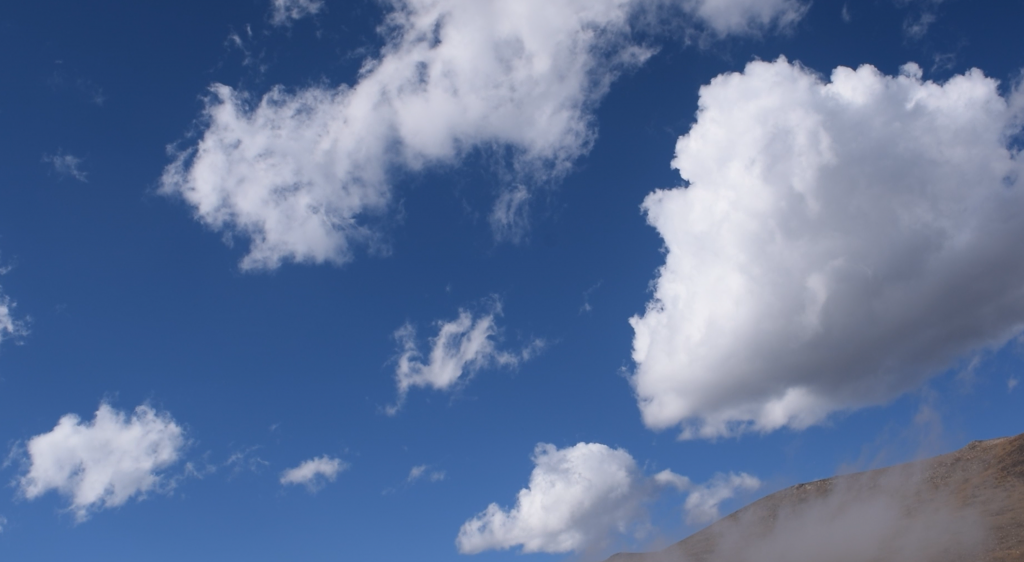
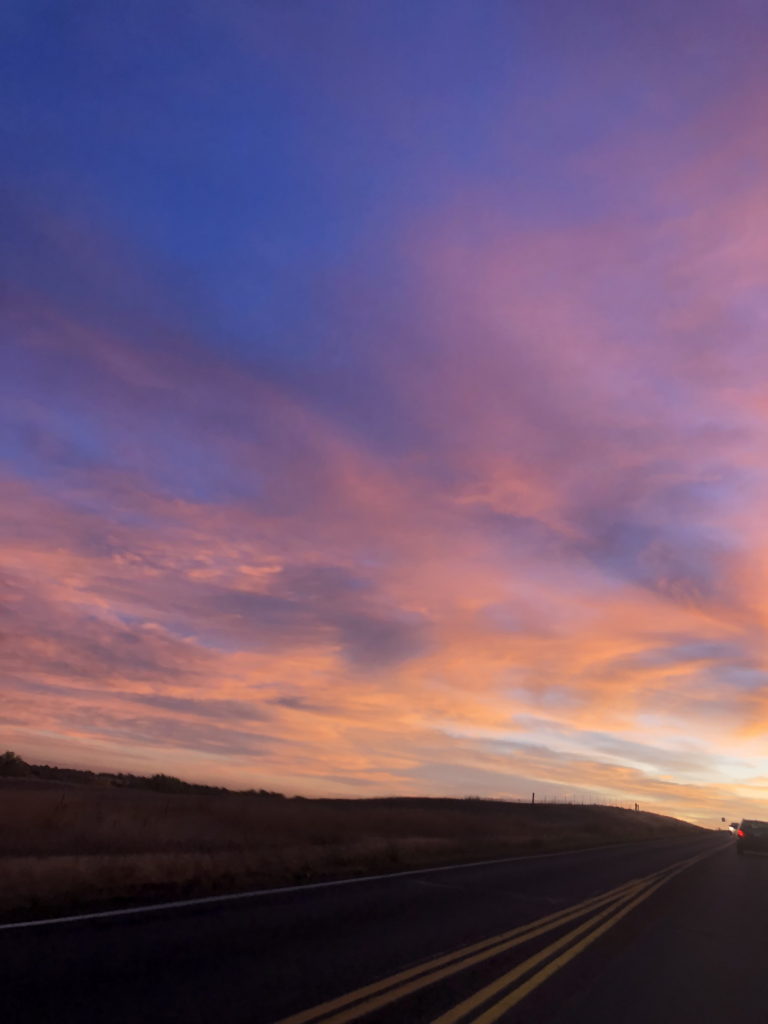
Best of Web 2018 | Abbie Rastatter
‘Hydrocarbon vs Ink – Implosion’
The flow visualization is driven by the Marangoni effect – the movement of fluid from lower to higher surface tensions. I was mesmerized by the quickly moving ink; the way that it at first was driven swiftly away from itself, only to gather back together in an outer ring, and later in the video as a sort of nucleus in the middle. I was reminded of galaxies but also retinal patterns as I watched this video. Truly stunning. And I just think the purple is pretty.
This visualization comes from Chemical Bouillon – I couldn’t find their names, but it’s three french guys who have an entire YouTube channel dedicated to “studying the graphic aspect of chemical reactions.”
Categories
Flow Vis Guidebook
- Introduction to the Guidebook
- Overview 1: Phenomena. Why Does It Look Like That?
- Overview 2: Visualization Techniques
- Overview 3: Lighting
- Overview 4 - Photography A: Composition and Studio Workflow
- Overview 4 - Photography B: Cameras
- Overview 4 - Photography C: Lenses - Focal Length
- Overview 4 - Photography C: Lenses - Aperture and DOF
- Overview 4: Photography D: Exposure
- Overview 4 - Photography E - Resolution
- Overview 5 - Post-Processing
- Clouds 1: Names
- Clouds 2: Why Are There Clouds? Lift Mechanism 1: Instability
- Clouds 3: Skew - T and Instability
- Clouds 4: Clouds in Unstable Atmosphere
- Clouds 5: Lift Mechanism 2 - Orographics
- Clouds 6: Lift Mechanism 3 - Weather Systems
- Boundary Techniques - Introduction
- Dye Techniques 1 - Do Not Disturb
- Dye Techniques 2 - High Visibility
- Dye Techniques 3 - Light Emitting Fluids
- Refractive Index Techniques 1: Liquid Surfaces
- Refractive Index Techniques 2: Shadowgraphy and Schlieren
- Particles 1- Physics: Flow and Light
- Particles 2: Aerosols
- Particles 3: In Water
- Particles 4 -Dilute Particle Techniques
- Art and Science
- TOC and Zotpress test
- Photons, Wavelength and Color