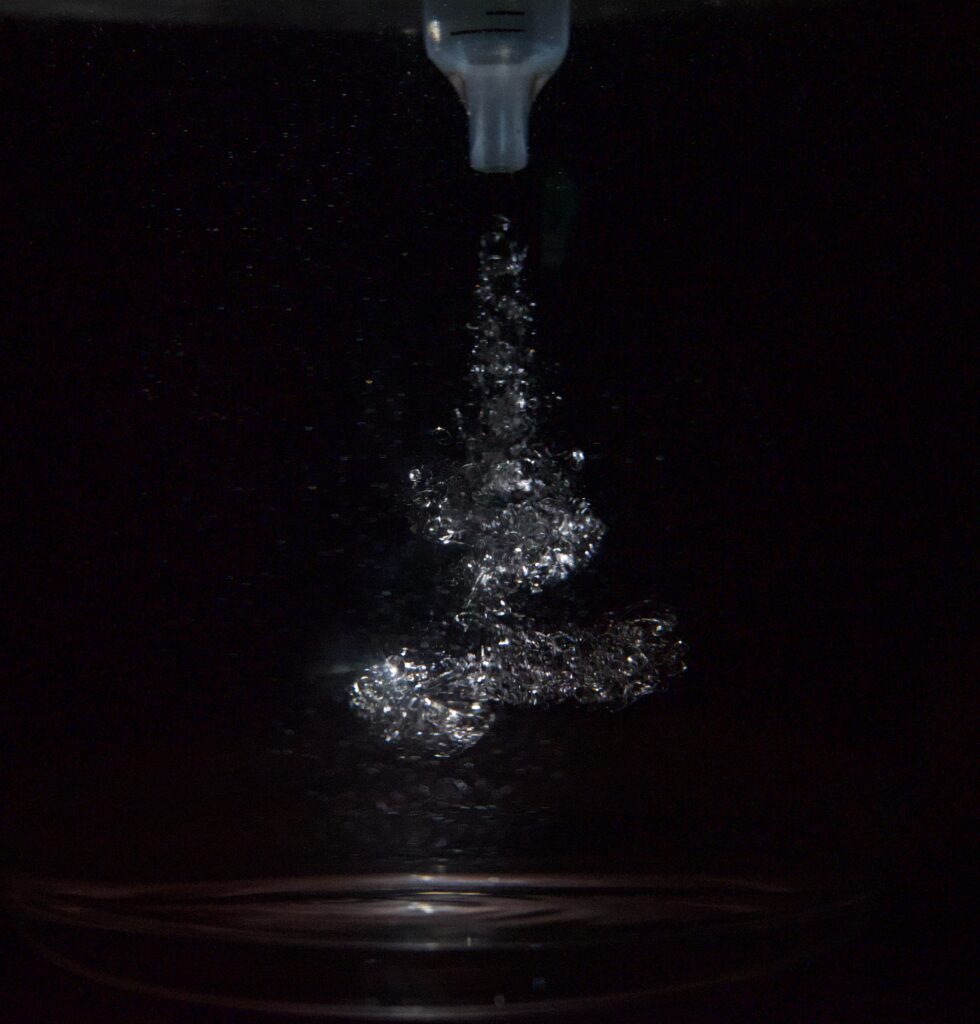
I created this visualization to recreate what happens inside an internal combustion engine when fuel is injected. The dispersion of droplets of fuel, vegetable oil in this case, shows how the battle between the Reynolds number, inertial forces vs viscous forces, and the Weber number, inertial forces vs surface tension, describe how oil changes into droplets. By using oil and water there is high drag and chemically adverse fluids to create a fast and dramatic separation of fluids that is easier to catch than a fine mist in air.
Report:
Get Wet
Nick Rhodes
Visualization of Atomization
The purpose of this experiment was to visualize the atomization of fluid and draw parallels to how fuel injectors can efficiently inject fuel into combustion chambers. Due to equipment constraints, the experiment was scaled up to use a syringe injecting vegetable oil into water. The intent was to capture the forces experienced by an injected fluid particularly shear, surface tension, and inertia, and their impacts on droplet formation. This visualization provides insight into the physics of atomization, which is critical for efficient fuel-air mixing in combustion systems.
The experiment setup consisted of a 5 mL syringe with a narrow tip injecting vegetable oil into a large glass container filled with water, shown in Appendix A. The oil entered the still water at high velocity, forming a plume that broke into droplets due to shear stresses from the drag in the water. When thinking about how to describe and characterize these equations prior studies were critical due to the complexity of fluid dynamics. It became apparent that the Reynolds number and Weber number (equations below) are both important factors when looking at droplet sizing and turbulence, in turn improving mixing and burning efficiency (Lasheras et al., 1998).
Where:
– ρ is the density of the surrounding fluid (kg/m³)
– U is the injection velocity (m/s)
– D is the nozzle diameter (m)
– μ is the dynamic viscosity of the injected liquid (Pa·s)
– σ is the surface tension (N/m)
To estimate the Re and We numbers we can assume U = 1 m/s, D = 1 mm = 1 × 10⁻³ m, ρ = 1000 kg/m³ (water), and μ = 0.1 Pa·s (vegetable oil), . with σ = 0.03 N/m,
. The Re and We numbers seem very low because we are seeing droplets occur, but this is because these numbers are for the liquid in the nozzle. As the oil is allowed to expand into the water D will go up to ~ .1 m making the Re= 3,333 and We=1,000. Indicating that as the oil is able to expand the droplets are more likely to form. You can see this in the image, the oil leaving the nozzle is a solid stream but breaks up into droplets as the area it can expand in to grows.
Vegetable oil was chosen as the working fluid because it would not mix and the differences in refractive indices, making the effects more visible and easier to light. The water increased drag and thus increased shear to break the oil into droplets. This is a similar end result to an injection nozzle but instead the droplets are produced by pushing fluid through a very small hole. Lighting was provided using a single up-light source in a dark room, which improved visibility of the droplets and highlighted the plume. The full setup can be seen in appendix B.
The image was captured with a Nikon Z5 mirrorless camera using a 50 mm focal length. Settings included f/6.3, shutter speed of 1/2500 s, and ISO 10,000. The field of view was approximately 10 cm, and the distance from the syringe to lens was 45 cm. Very little editing of the photo was done, mainly cropping and adjusting lighting to hide any noise in the dark parts of the photo.
The final image successfully reveals the chaotic breakup of the oil jet and the droplet plume, illustrating the balance of inertia, shear, and surface tension. I particularly like how the flow is laminar at the nozzle exit and then turns into droplets, showing how the diameter of the space impacts droplets ability to form. A brighter light source would allow for a lower ISO and would improve resolution. In future iterations, controlled injection velocity could allow a correlation to be derived from this experiment. Fuel injection systems are designed to maximize droplet uniformity for efficient combustion (Lefebvre & McDonell, 2017). Based on my experiment and explanation of Re and We, having very high injection speeds that increase in speed throughout the injection process would create more uniform droplets across the entirety of the injection.
Overall, the experiment met its goal of demonstrating atomization at a larger scale and provided a visualization to real world fuel injection.
References:
Lefebvre, A.H., & McDonell, V.G. (2017). Atomization and Sprays. CRC Press.
Lasheras, J.C., Villermaux, E., & Hopfinger, E.J. (1998). Break-up and atomization of a round water jet by a high-speed annular air jet. Journal of Fluid Mechanics, 357, 351–379.
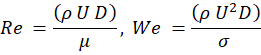
Appendix A:
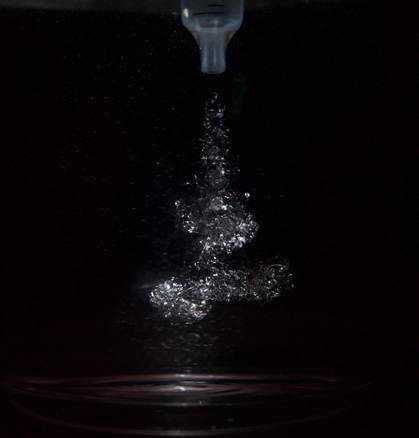
Figure 1: Final Image of Injection
Appendix B:
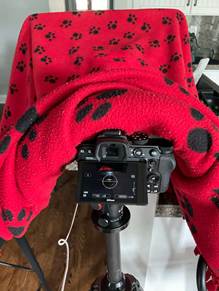
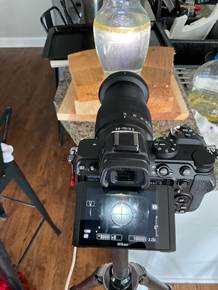
Figure 2, 3, and 4: Images of experiment setup
1 Comment. Leave new
My question in critique was: what aperture did you use and how much did you have to play around with lighting and exposure settings to refract the light and get a good shot like this?