
Thermal Plumes Rising from a Heated Stainless Steel Puck
Evan Mason
Team First
October 5, 2026
The purpose of this video was to capture how water heated by a hot object rises through cooler water and how the warm water layer from the object breaks into many thin plumes as it climbs. This was the Team First assignment, and I worked on it with Justin Arni and Ken Fujiwara. The clear water has no dye in it, so instead of adding color, we used the way warm water bends light. A stainless steel espresso tamper was heated on a stove and set on the bottom of a tank of room-temperature water, and a bright bike light cast shadows of the rising warm water onto a white board behind the tank. A still frame from the video is shown in Figure 1, and the full video is at youtube.com/watch?v=4tGnjo6sf-0.
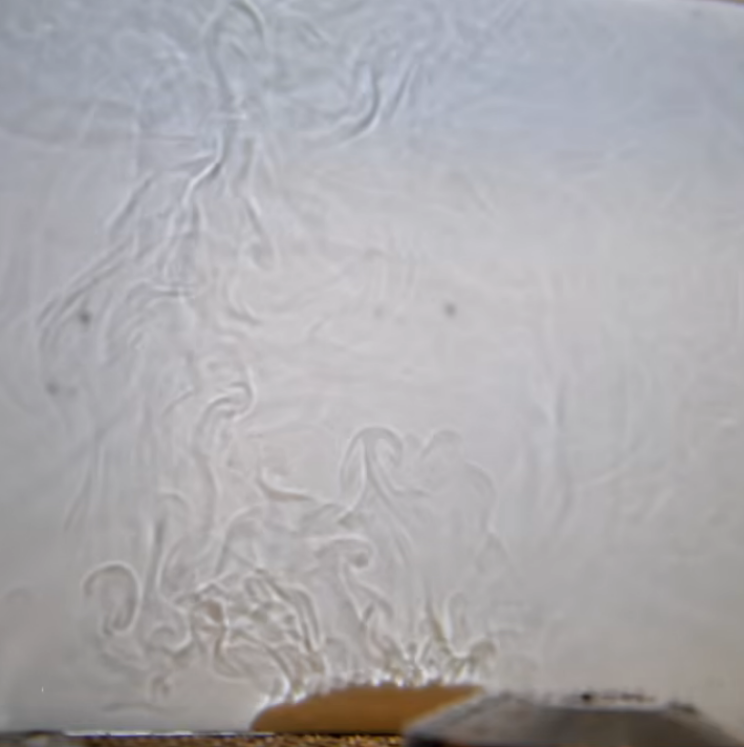
Figure 1. Still frame from the video showing thermal plumes rising from a heated espresso tamper in still water.
The setup is shown in Figure 2. The same clear rectangular tank from my first image, measuring 12 x 6 x 8 inches, was filled with room temperature tap water to a depth of 6 inches and left to settle so the water was as still as possible. A white board stood directly behind the tank so that it filled the background of the frame. The tamper is a solid stainless steel puck about 2 inches across. It was heated on a stove for 5 minutes, and then lowered onto the bottom of the tank with its flat face up. The bike light sat 6 feet in front of the tank and pointed through the water at the white board, and a floor lamp with LED bulbs stood about 1 foot from the tank. Once the tamper was in the water, the warm water above it began to rise right away and kept rising for the length of the clip.
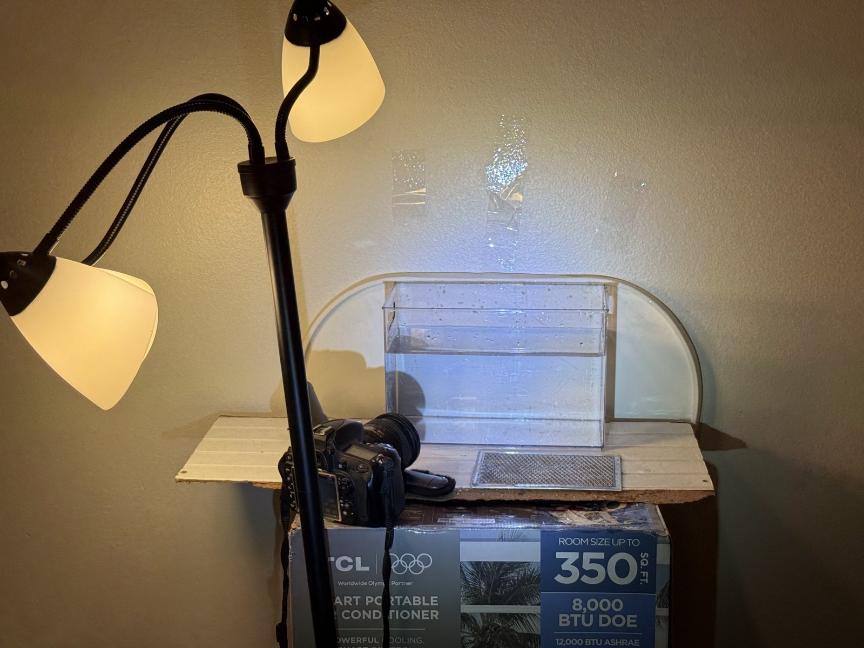
Figure 2. Photo of the experimental setup, showing the tank in front of the white board, the floor lamp, and the camera.
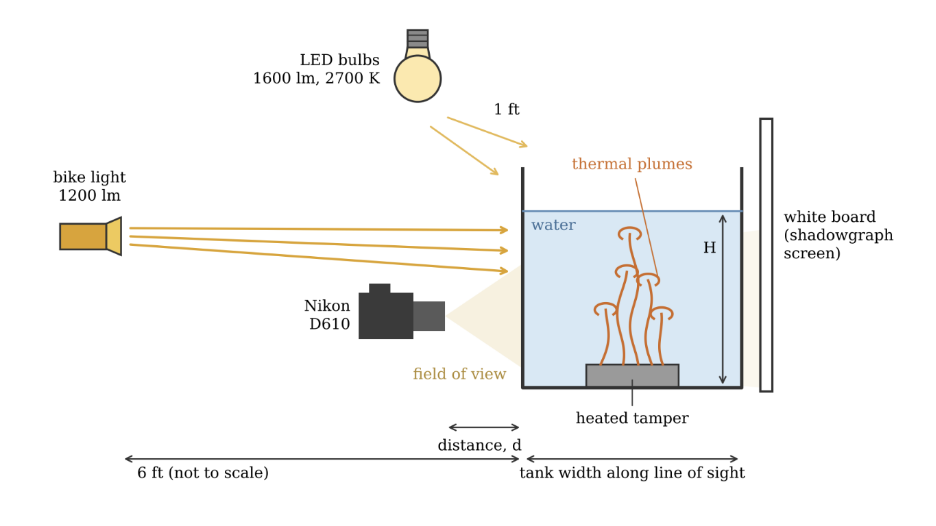
Figure 3. Sketch of the experimental setup
The main force acting on the fluid is buoyancy. Water touching the hot tamper heats up and expands, so it becomes less dense than the water around it, and gravity pulls the cooler, heavier water down underneath it. The warm water is pushed upward while viscous forces resist the motion. A flow driven this way is called natural convection, and a narrow column of rising heated fluid is called a thermal plume. In researching this behavior, I found that Sparrow, Husar, and Goldstein (1970) observed that the warm layer above a heated horizontal surface does not lift off as one sheet. It breaks away at separate spots as individual thermals, each with a rounded cap on a thinner stem. Turner (1973) describes the same mushroom shape for the front of a starting plume, where the cap rolls up as it pushes into the still fluid above it. Both features show up in the video. A row of thin plumes leaves the top of the tamper, and the tallest ones end in rounded caps.
To estimate the scales of the flow, I treated a single plume as a column of width D = 5 mm. I did not measure the temperature of the tamper or the plumes, so I assumed the rising water is about 10 °C warmer than the 20 °C tank water. Using a thermal expansion coefficient of β = 2.6 × 10⁻⁴ 1/K for water near 25 °C (Bergman et al. 2011), the reduced gravity is g′ = gβΔT = (9.81 m/s2)(2.6 × 10−4 1/K)(10 K) ≈ 0.026 m/s2. The only source of motion is the density difference itself so I chose a buoyancy velocity scale.
U ~ (g′D)1/2 = [(0.026 m/s2)(0.005 m)]1/2 = 0.011 m/s
Using ν = 8.9 × 10⁻⁷ m2/s for water at 25 °C, the Reynolds number is
Re = UD/ν = (0.011 m/s)(0.005 m) / (8.9 × 10⁻⁷ m2/s) ≈ 60
A Reynolds number of about 60 means inertial and viscous forces are both important and the flow in each plume should be laminar, which agrees with the video. The plume edges are smooth, continuous lines that bend and fold but do not break up into fine-scale turbulence. At this velocity a plume would cover the roughly 8 cm of height shown in the frame in about L/U = (0.08 m)/(0.011 m/s) ≈ 7 s.
To check why the warm layer breaks into many plumes instead of one, I also estimated the Rayleigh number, which compares buoyancy to the viscosity and heat diffusion that hold the layer in place. Using the tamper diameter L = 58 mm and a thermal diffusivity of α = 1.46 × 10⁻⁷ m2/s,
Ra = gβΔTL3/(να) = (0.026 m/s2)(0.058 m)3 / [(8.9 × 10⁻⁷ m2/s)(1.46 × 10−7 m2/s)] ≈ 4 × 10⁷
Convection in a fluid layer heated from below begins at a Rayleigh number of about 1700 (Turner 1973). A value of 4 × 10⁷ is more than four orders of magnitude higher, so the warm layer on the tamper is strongly unstable and sheds plumes continuously from many places at once.
The visualization technique was shadowgraphy. No dye or particles were added to the water. The index of refraction of water drops slightly as it warms, so light passing through the edge of a warm plume is bent a little away from its original path. On the white board behind the tank, the bent light piles up in some places and leaves others short, which draws each plume edge as a bright line next to a darker one (Settles 2001). The shadows show where the temperature is changing sharply, not the temperature itself, which is why the plumes look like outlines and not filled shapes. The light source was a VASTFIRE VA-B01 bike light rated at 1200 lumens and 15 watts, placed 6 feet from the tank. A small, bright source far from the tank works well for this because the light arriving at the water is nearly parallel, and that keeps the shadows sharp. The floor lamp held GE Relax LED bulbs rated at 1600 lumens and 13.5 watts with a 2700 K color, about 1 foot from the tank, and it lit the rest of the scene. To repeat the video, fill the tank and let the water settle, stand the white board behind it, aim the bike light through the tank from 6 feet away, focus on the board just above where the tamper will sit, start recording, and lower the heated tamper into the water.
The video was taken with a Nikon D610, a full-frame digital SLR, using a Nikon 24-85mm f/3.5-4.5G ED VR AF-S NIKKOR lens at a focal length of [focal length] mm. The camera was about 6 inches from the tank, and the field of view of the final video is about 6 inches across. I recorded at 1920 × 1080 pixels and 30 frames per second, at f/4 with a shutter speed of 1/800s and an ISO of 400.
The only processing to the video was cropping into a square aspect ratio and trimming the clip to length. No color or contrast adjustments were made.
The video shows warm water leaving the top of the tamper throughout the clip. Along the top edge of the tamper, there are closely spaced plumes rising from the surface. Above that, the plumes lean together and merge into a taller column, and the leading plumes end in rounded caps that curl over. Fainter lines fill the rest of the frame where warm water from earlier plumes has spread out and is still drifting. I like that the flow remains visible, since there is nothing in the water but a temperature difference, and I like how the fine lines make the plumes look like a pencil drawing. The physics of a buoyancy driven flow are shown well, since the separate plumes and their caps are what Sparrow, Husar, and Goldstein (1970) and Turner (1973) describe. What I dislike is that the contrast is low, so the plumes are hard to see without looking closely, and that an out of focus object in the foreground blocks the lower right corner and part of the tamper. There are also dark specks from bubbles and marks on the tank walls. I met my main intent of showing thermal plumes in clear water without dye. To improve the video, I would turn off the floor lamp and darken the room so the bike light is the only source, clean the tank walls, clear the foreground, and measure the temperature of the tamper and the water so the estimates above use real numbers instead of an assumed 10 °C. I will also try moving the white board farther behind the tank, since Settles (2001) notes that shadowgraph contrast grows with the distance from the flow to the screen. A question I still have is how the number and spacing of the plumes change as the tamper cools.
References
Bergman, T. L., Lavine, A. S., Incropera, F. P., and DeWitt, D. P. (2011). Fundamentals of Heat and Mass Transfer, 7th ed. Wiley.
Settles, G. S. (2001). Schlieren and Shadowgraph Techniques: Visualizing Phenomena in Transparent Media. Springer.
Sparrow, E. M., Husar, R. B., and Goldstein, R. J. (1970). Observations and other characteristics of thermals. Journal of Fluid Mechanics 41(4): 793-800.
Turner, J. S. (1973). Buoyancy Effects in Fluids. Cambridge University Press.
1 Comment. Leave new
What a great way to visualize a gaseous flow. It’s great to see this on a white background but I’m curious as to how it would look on a background that is illuminated by a soft colored light. What is this gas?