

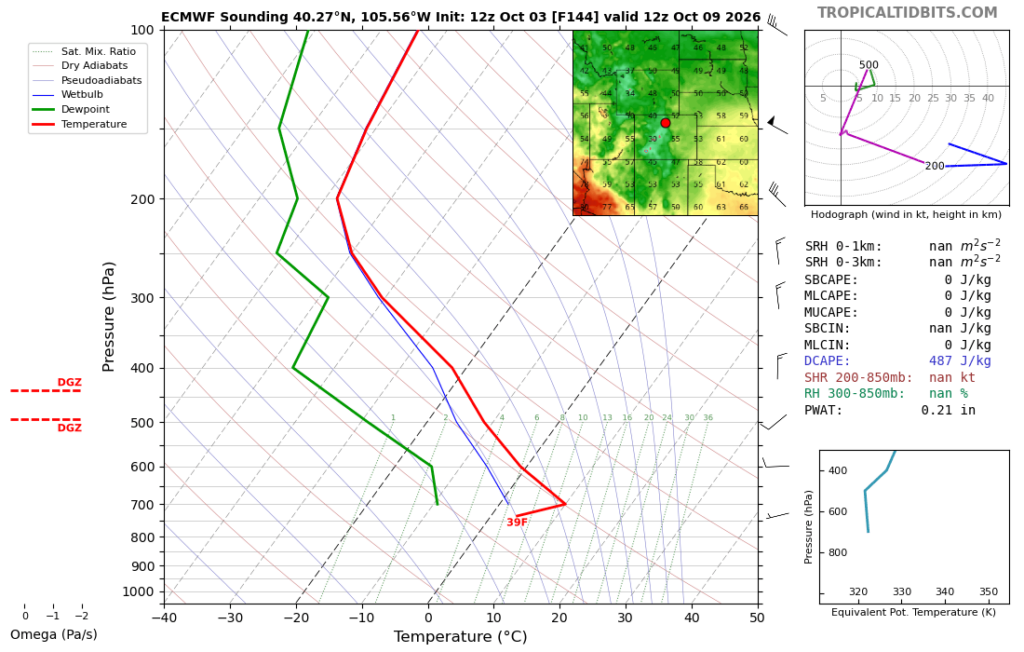
Figure 1: Simulated data of Skew-T Plot
==============================================================================================================================
Figure 2: Actual data of Skew-T Plot
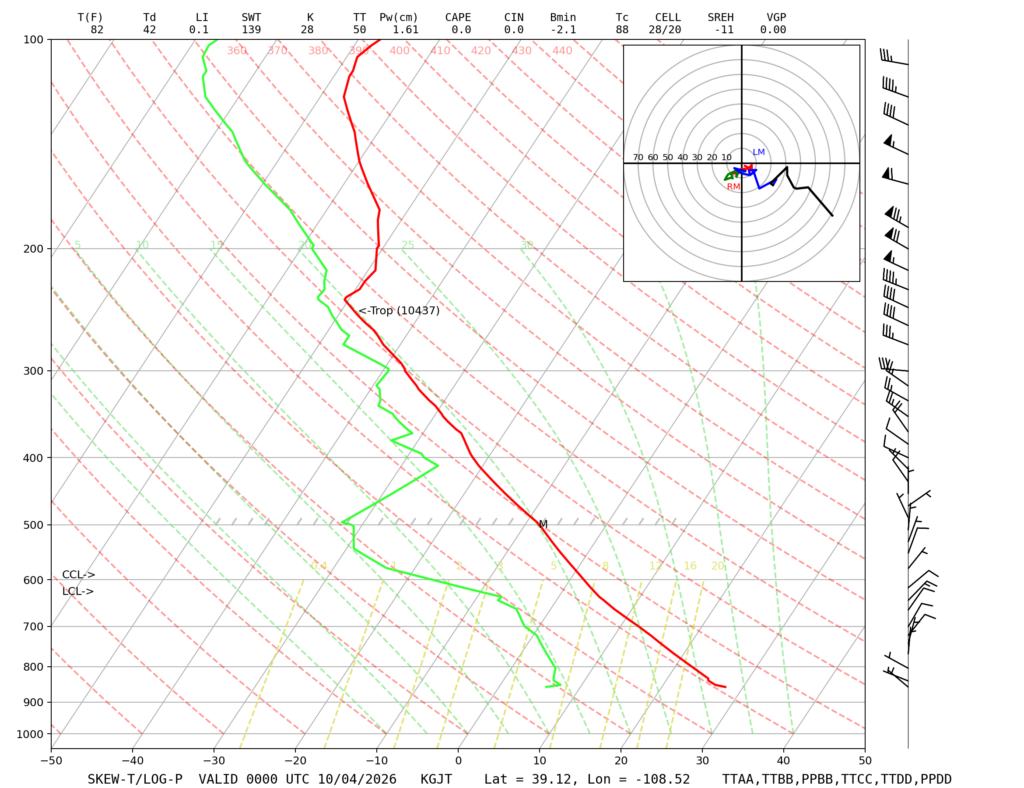
Attached is my Clouds First visual, as well as two Skew-T diagrams. The simulated is using the actual location (Long’s Peak Trailhead), whereas the actual data is using an approximation differing by a couple degrees in both longitude and latitude. Based on the diagrams and the size/location of the cloud, I believe it is a Stratocumulus. I also believe it is a stable cloud as such.

