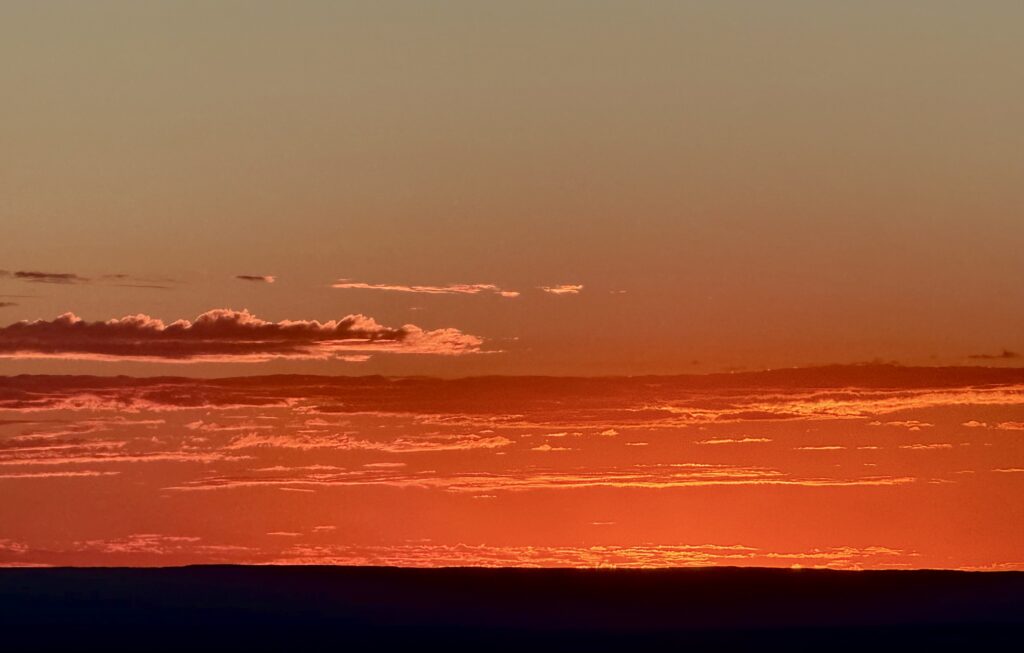
Cloud image, taken at the Grand Canyon on October 5th at 6:18 PM.
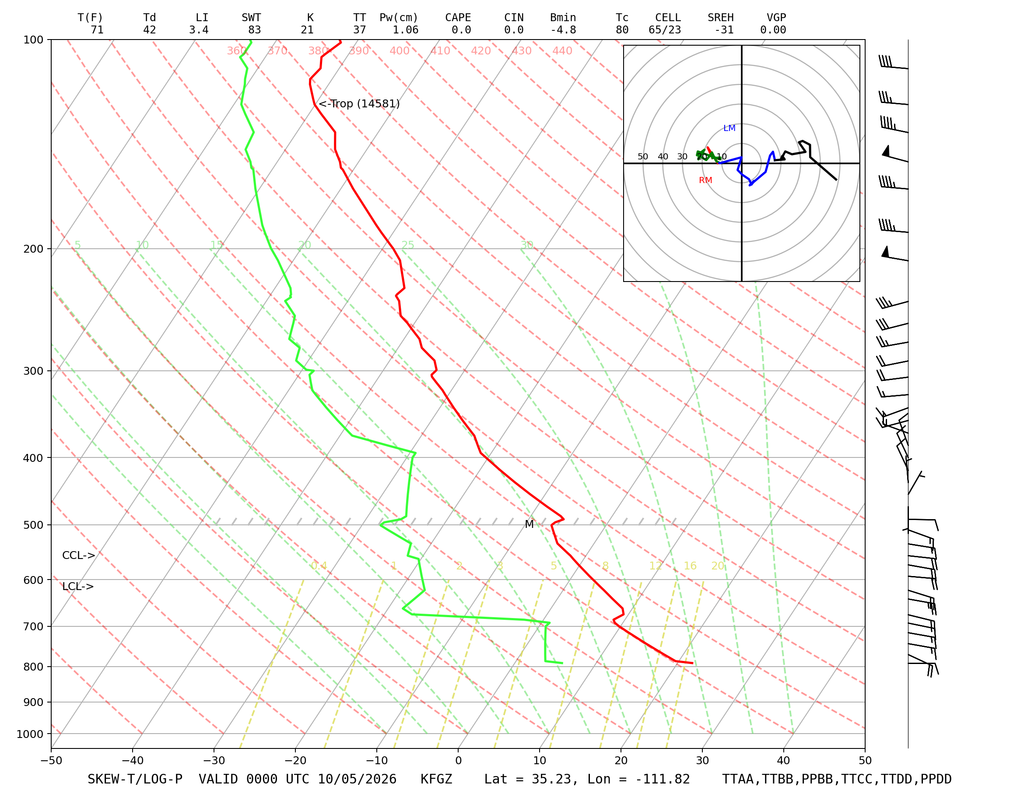
The following image is the Skew-T Diagram. From the image you can see layered mid-level altocumulus near the 600–500 mb moist zone, capped by inversions around 690 and 500 mb, so the clouds spread out flat instead of building up.