
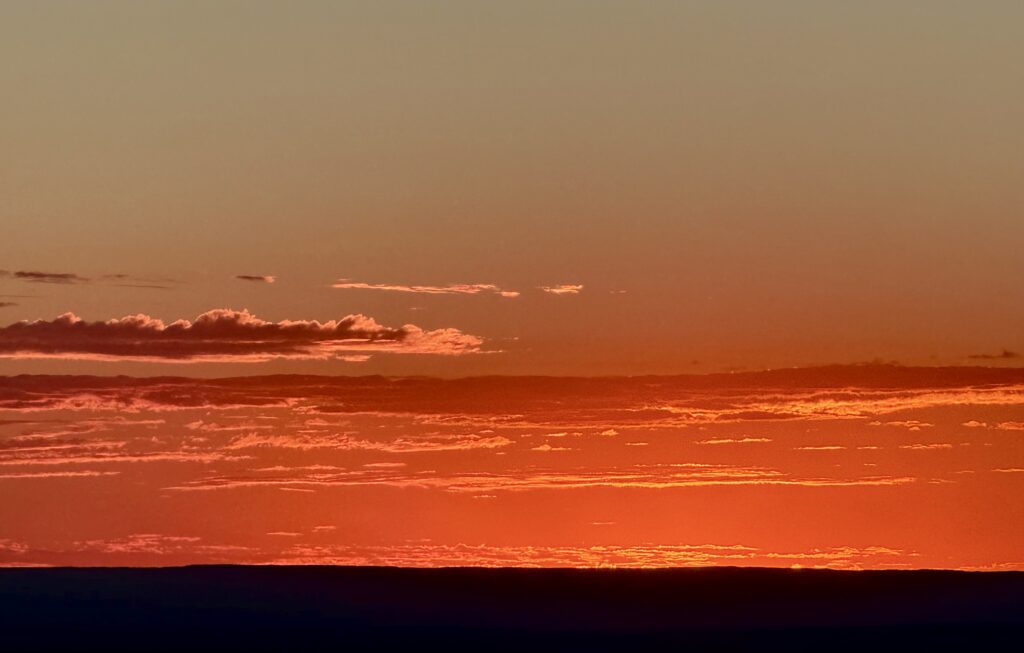
Cloud image, taken at the Grand Canyon on October 5th at 6:18 PM.
The following image is the Skew-T Diagram. From the image you can see layered mid-level altocumulus near the 600–500 mb moist zone, capped by inversions around 690 and 500 mb, so the clouds spread out flat instead of building up.
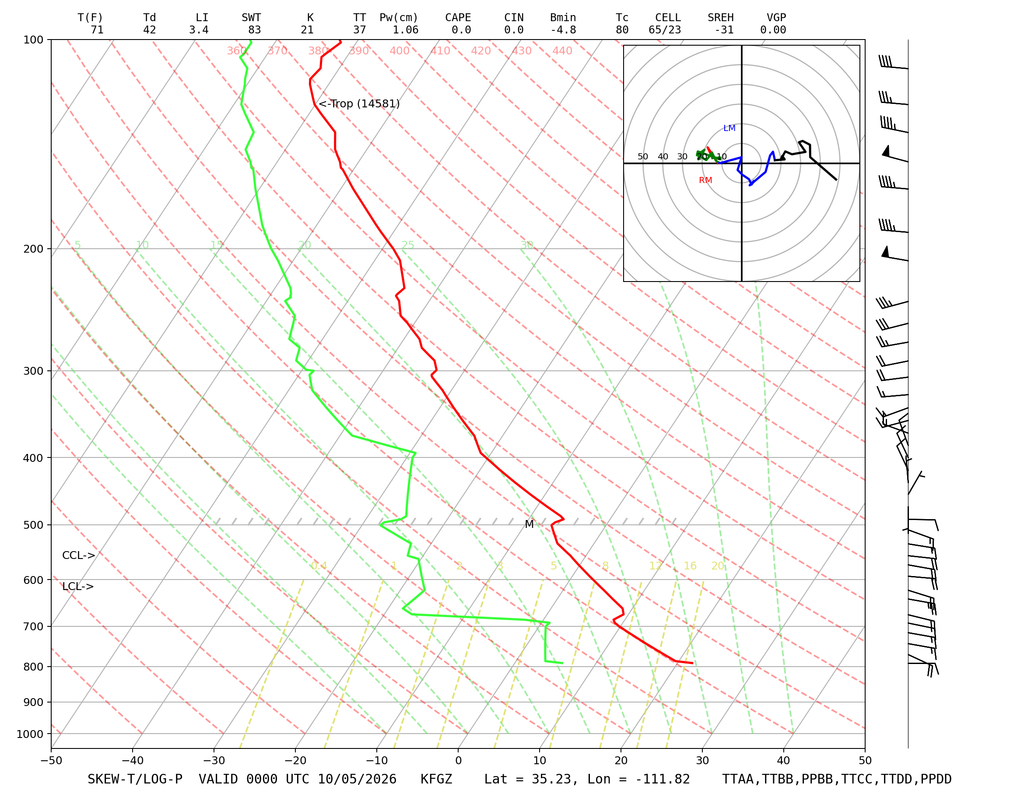
The report fod this image can be found here

